Scope 1
Direct emissions
- Stationary combustion
- Mobile combustion
- Process emissions
- Fugitive emissions


Carbon Accounting
An inventory is only useful if someone independent can trace it back to source. We build Scope 1, 2 and 3 accounts to GHG Protocol with the evidence trail attached, so assurance becomes a review rather than a rebuild.
Coverage
We resolve the questions that cause restatements later: organisational boundary, operational control, double counting and emission factor vintage.
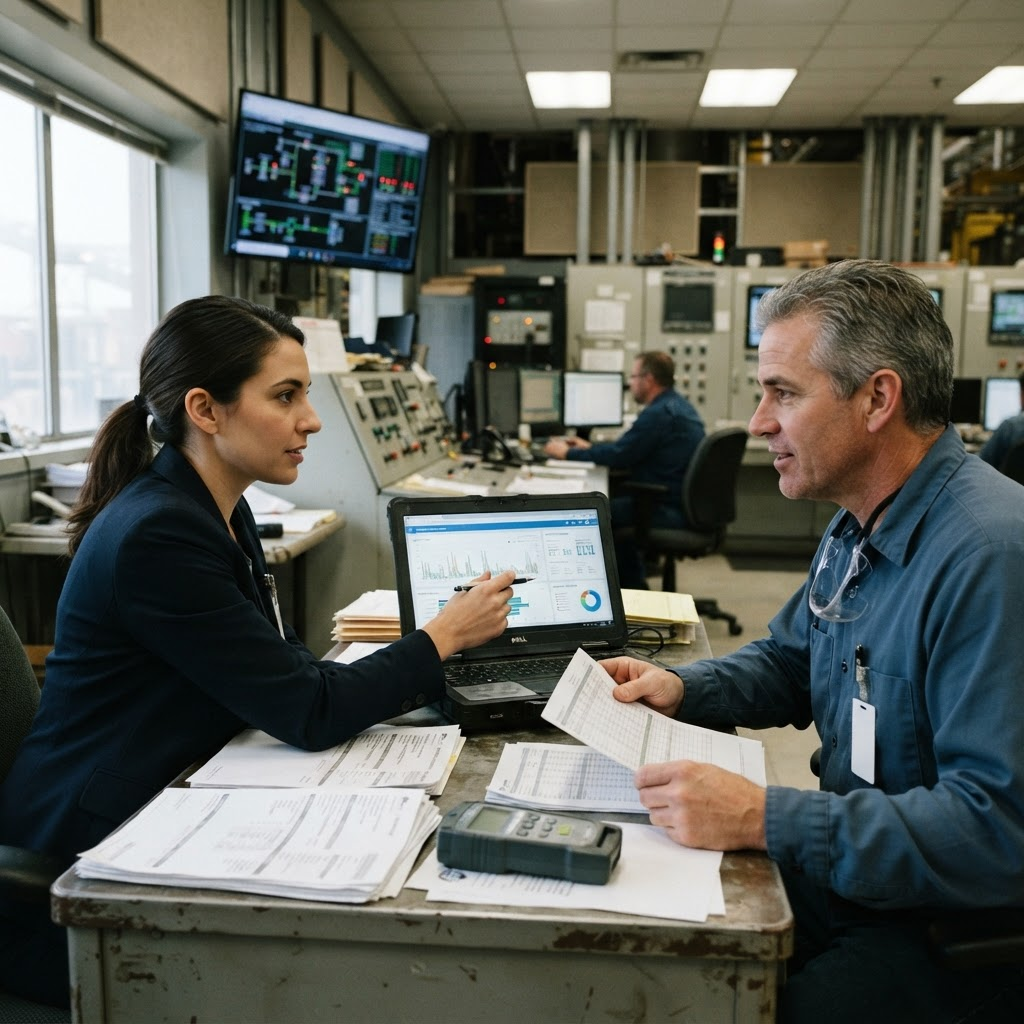
Every number has a source.
Evidence, ownership and methodology stay connected to the result.
Defensible data
Corporate carbon accounting involves complex data, organisational boundaries, emission factors and assumptions. BNZ Green creates a defensible emissions inventory with traceability from the final number back to its source.
Illustrative evidence chain
Coverage
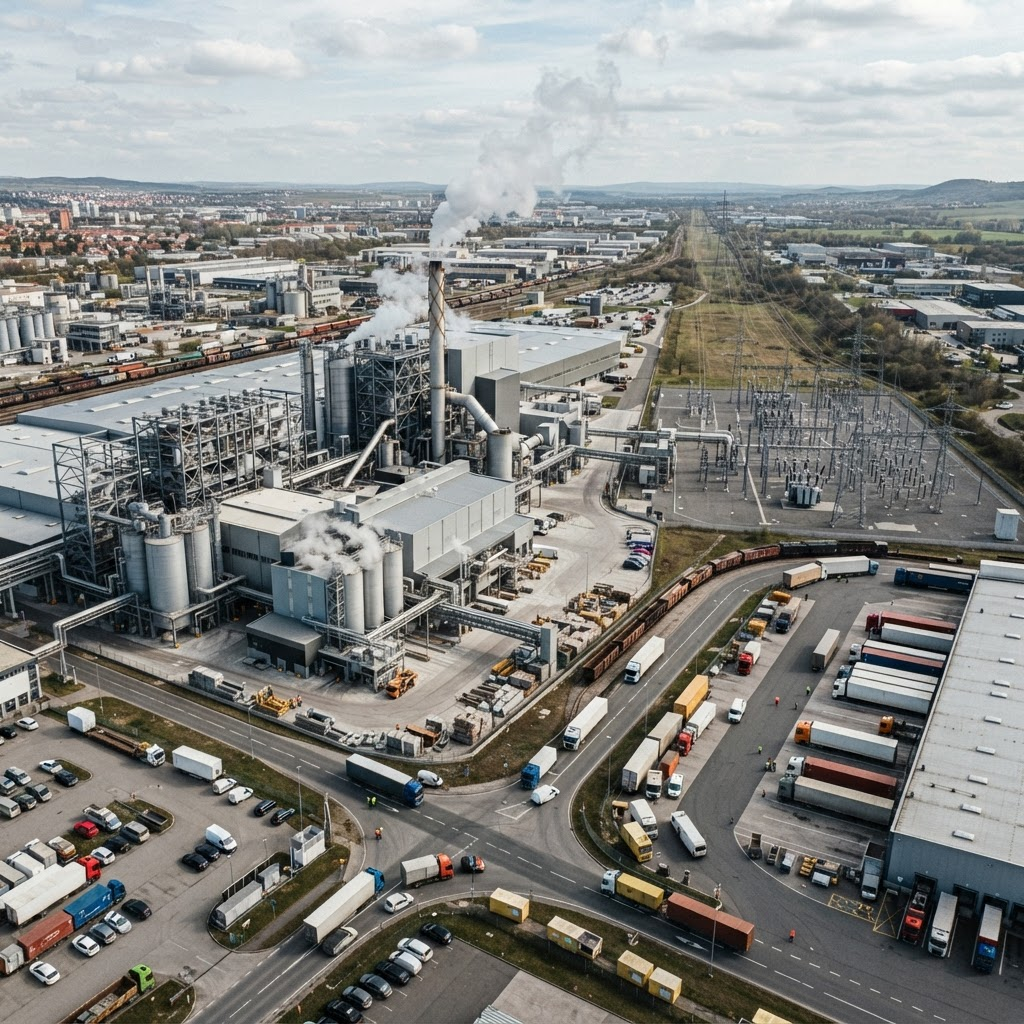
Scope 1
Scope 2
Scope 3
Data pipeline
Energy, fuel, travel, procurement, waste, logistics and supplier data move through a controlled calculation and quality process.
Value chain
Supplier data, procurement activity, logistics, business travel and other value-chain emissions can represent a significant share of an organisation's footprint. We help companies move from estimates toward better-quality, activity-based and supplier-specific data.
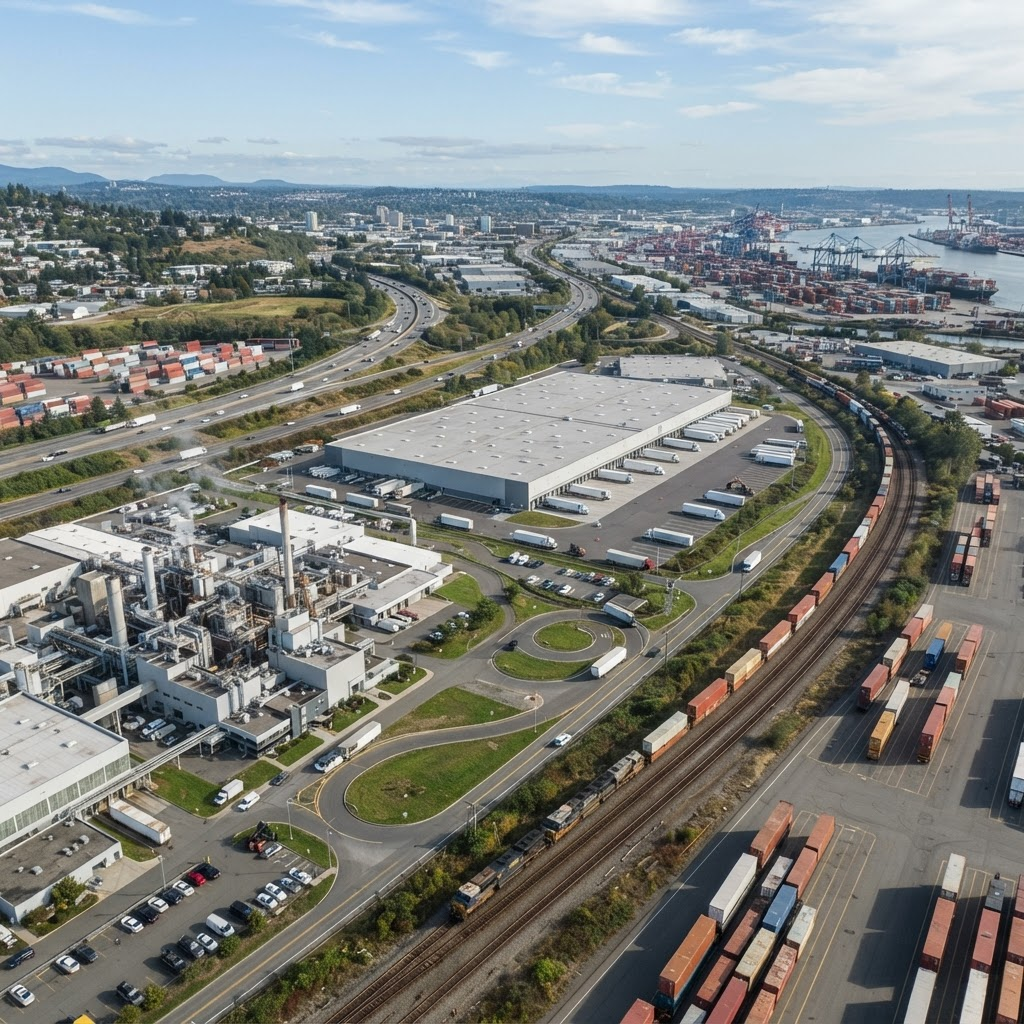
Screen → Identify material categories → Collect data → Improve data quality
Upstream
Downstream
Confidence
We don't hide uncertainty. We identify it, document it and create a pathway to improve data quality over time.
Current quality
Illustrative maturity view
High confidence
Primary activity data + documented evidence
Medium confidence
Secondary data + established factors
Estimated
Proxy, spend-based or modelled data
Audit trail
Illustrative carbon data record
Emission source
Purchased Electricity
Activity data
2,480,000 kWh
Source
Utility Invoice
Emission factor
Grid factor — FY2026
Calculation
2,480,000 × 0.82
Calculated result
2,033.6 tCO₂e
Annual operation
Organisational boundaries
Activity data & evidence
Factors & methodology
Quality checks & anomalies
Evidence & verification
Better data next cycle
Outputs
Corporate GHG Inventory
Scope 1, 2 & relevant Scope 3
Emissions Data Register
Sources, owners and methodologies
Emission Factor Register
Factors, sources and vintages
Boundary Documentation
Organisational and operational boundaries
Management report
Scope 1, 2 & relevant Scope 3
Data Quality Assessment
Confidence and estimation flags
Scope 3 Materiality Assessment
15-category screening
Evidence Pack
Supporting documentation
Management Insights
Hotspots, trends and gaps
From accounting to intelligence
What are our emissions?
Where are our biggest emissions?
Where do we want to go?
How do we reduce them?
Enterprise context

Energy + process + supply chain
Operations + value chain + financed emissions where applicable
Fuel + transport + business travel
Buildings + energy + leased assets
Multiple companies + facilities + reporting boundaries
Why BNZ Green
What’s next?
Decision pathway
Understand where your biggest emissions are coming from.
Explore Carbon IntelligenceDecision pathway
Turn your emissions baseline into a credible climate strategy.
Explore Net Zero StrategyDecision pathway
Turn your priorities into measurable decarbonisation action.
Explore Decarbonisation
Start with evidence
Let's establish your emissions baseline, improve data quality and build the evidence foundation for your climate strategy.
Questions
Rarely. We screen all 15 to identify which are material, then build those out properly. Attempting full depth across every category in year one typically produces a large volume of low-confidence data that nobody trusts.
Both. GHG Protocol requires dual reporting where market instruments are held, and the two figures answer different questions — grid exposure versus procurement choices. We calculate and present both.
Category boundaries are defined explicitly at the outset, with particular attention to the overlaps that cause problems: purchased goods against capital goods, and upstream transport against distribution.
Yes, and it is often necessary when a baseline was built without an audit trail. We reconstruct from source records where they exist and clearly flag where documented estimation was required.
Send us your current numbers and we will tell you where the assurance risk sits before you commit to anything.